> ## Documentation Index
> Fetch the complete documentation index at: https://wundergraphinc-brendan-add-external-directive.mintlify.site/llms.txt
> Use this file to discover all available pages before exploring further.
# Metrics
> Metrics give a general overview of the performance of your federated graph. From here you can zoom in on specific time ranges and filter metrics by operation name, client name, and version.
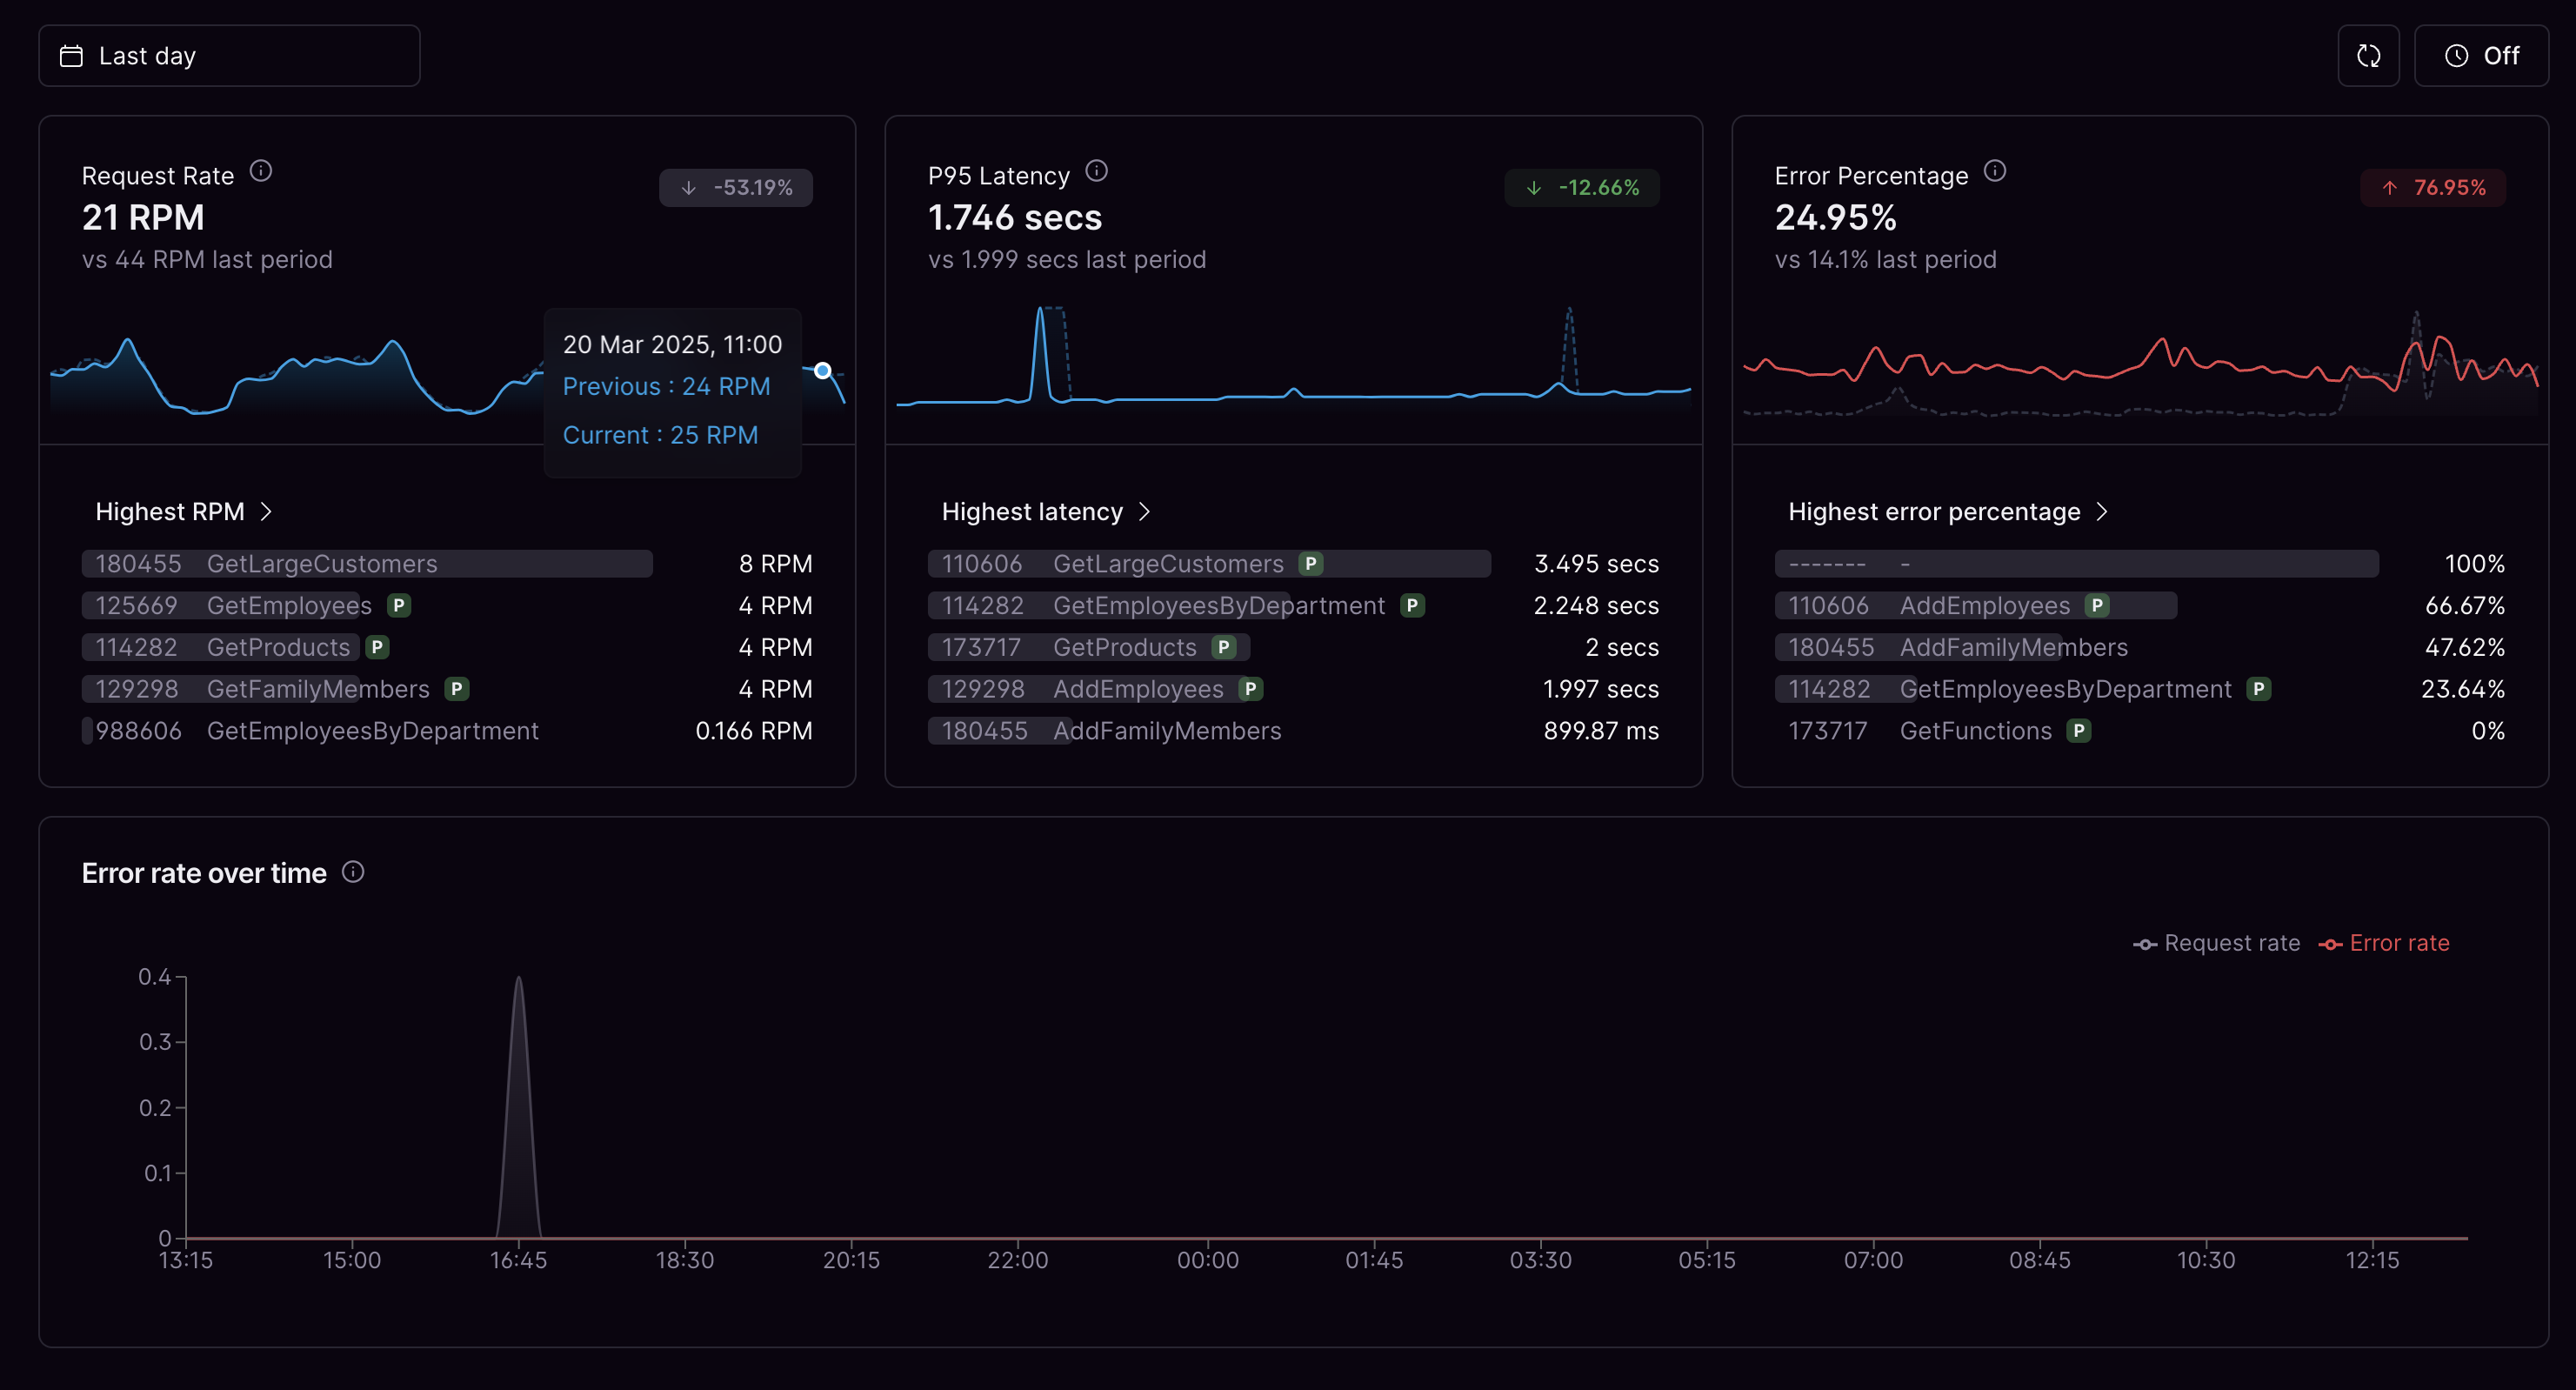 ### Request rate
The average requests per minute for the selected time range.
### P95 latency
The average p95 latency for the selected time range.
### Error rate
The average error percentage for the selected time range. This includes 4xx and 5xx errors.
### Error rate over time
The amount of GraphQL requests and errors over time.
### Request rate
The average requests per minute for the selected time range.
### P95 latency
The average p95 latency for the selected time range.
### Error rate
The average error percentage for the selected time range. This includes 4xx and 5xx errors.
### Error rate over time
The amount of GraphQL requests and errors over time.